


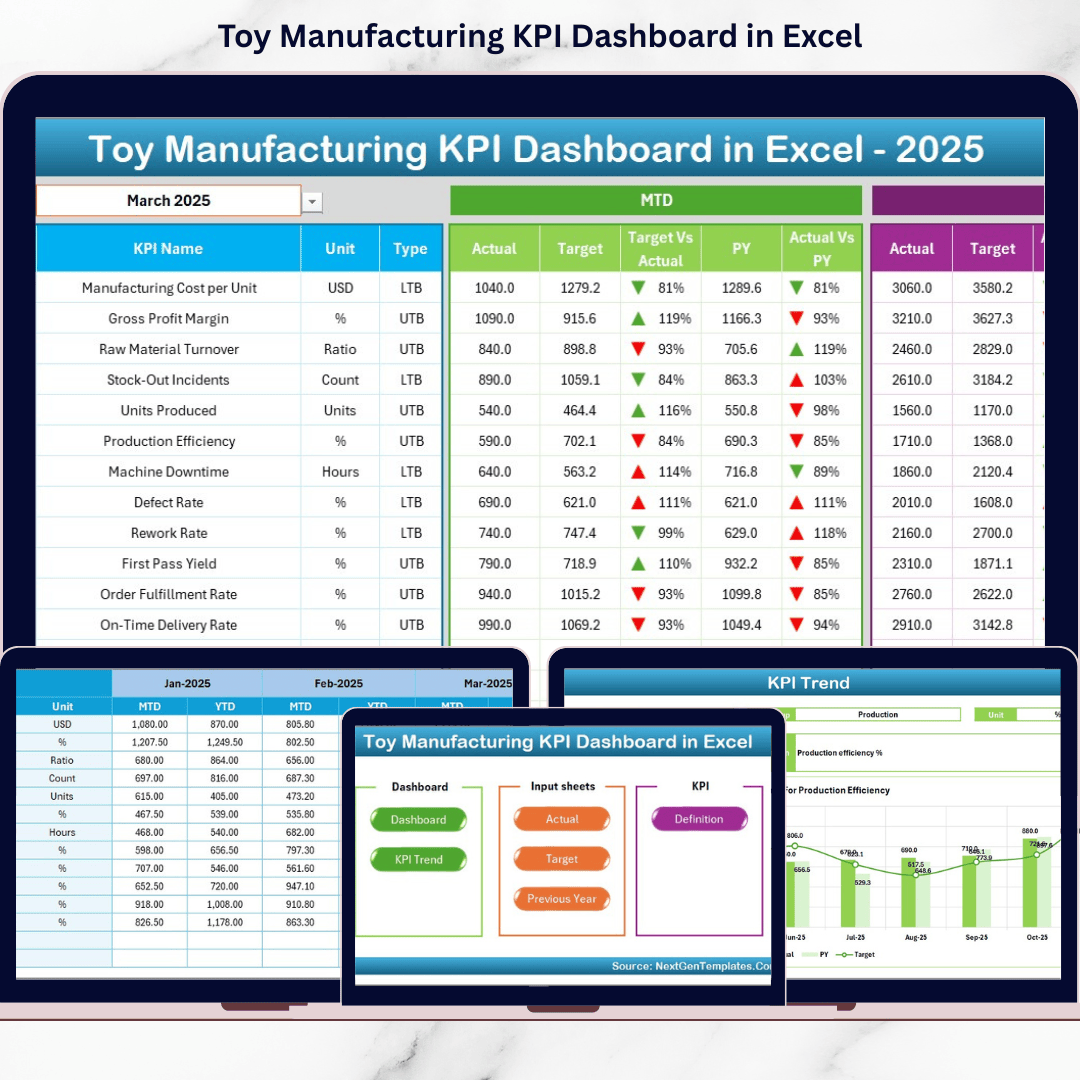





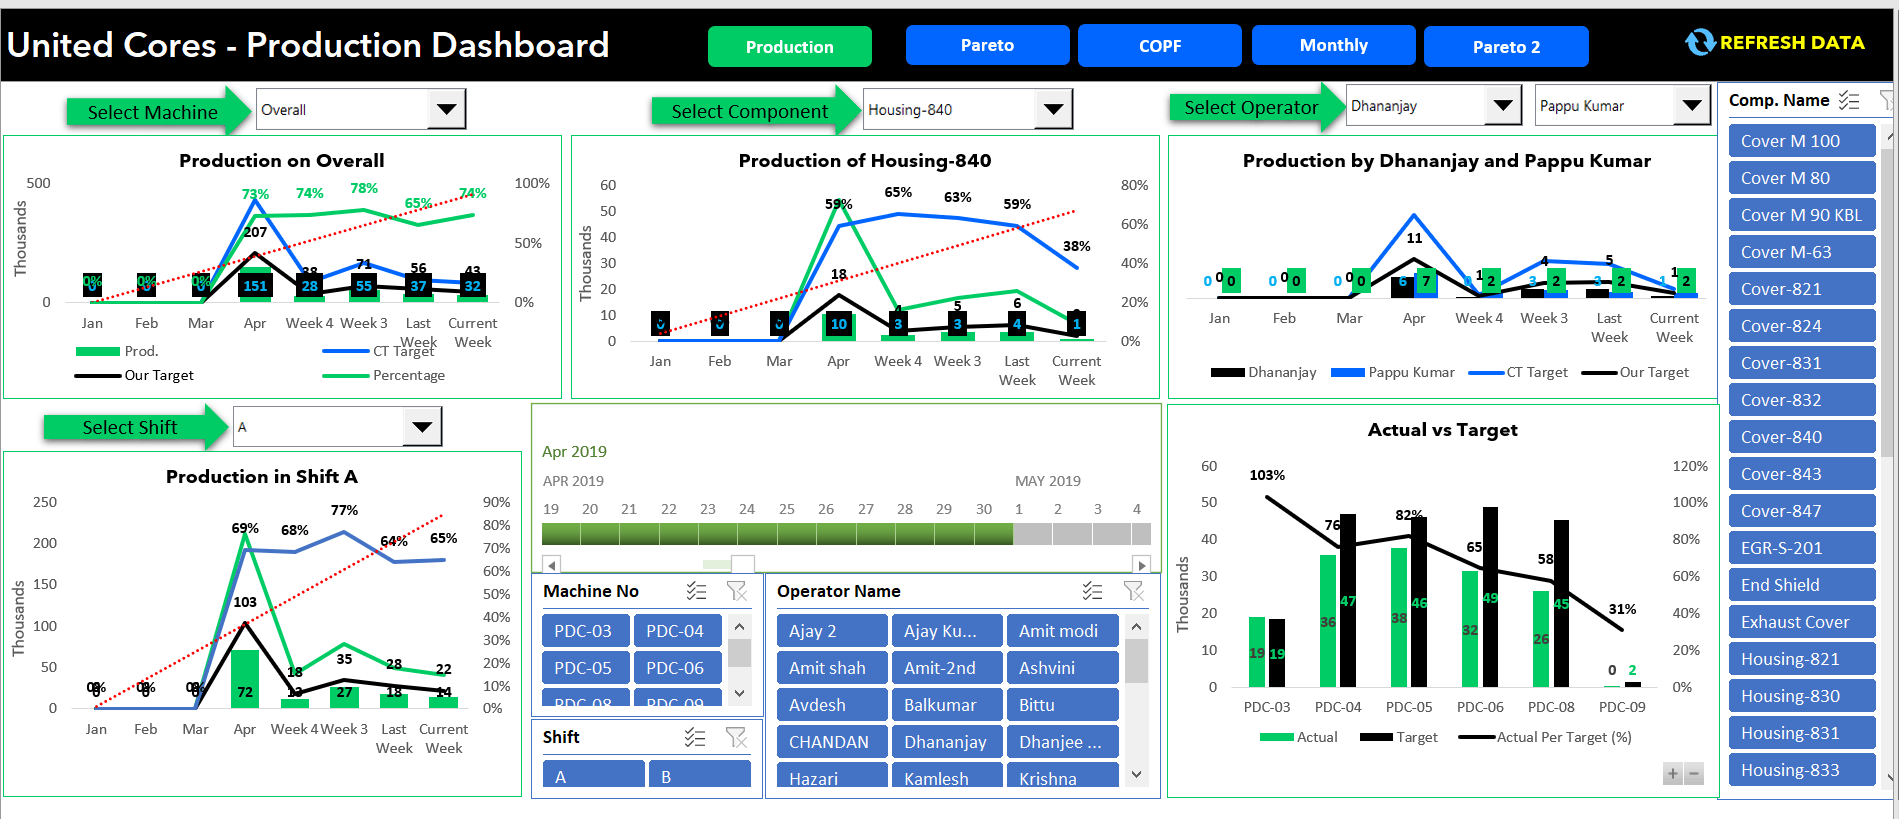


Running a manufacturing operation today means juggling a ton of moving parts. From raw materials to finished goods, keeping track of everything can feel like a game of whack-a-mole. This is precisely where Excel manufacturing dashboard templates step in, offering a powerful yet accessible way to visualize your operations and make sense of all that data.
Think of these templates as your personal command center, laid out clearly in Excel. They help you see what’s working, what’s not, and where you need to focus your energy. For young professionals entering the manufacturing scene or seasoned managers looking for an edge, understanding and utilizing these dashboards is becoming a non-negotiable skill to drive real business growth.
Why Is Data Management So Tough in Manufacturing
The core problem for many manufacturing businesses boils down to data overload without clear insights. Information often lives in disconnected spreadsheets or legacy systems, making it incredibly hard to get a unified view of performance. Without this clarity, decisions are often based on guesswork rather than solid facts.
Imagine trying to steer a ship without a compass or a map. That's what managing a factory without a proper dashboard feels like. Production delays, unexpected equipment breakdowns, and inaccurate inventory counts become daily headaches, directly impacting profitability and customer satisfaction. The struggle isn't collecting data, it's making it speak to you.
| Core Manufacturing Challenges | How Dashboards Help |
|---|---|
| Fragmented Data Sources | Consolidates information into one visual report |
| Slow Decision Making | Provides real-time, actionable insights |
| Lack of Performance Visibility | Highlights key performance indicators (KPIs) |
| Inefficient Resource Use | Identifies bottlenecks and waste areas |
| Reactive Problem Solving | Enables proactive issue identification |
Without a structured way to view key metrics, manufacturing companies often find themselves reactive, constantly putting out fires instead of preventing them. This reactive cycle saps resources and prevents strategic growth. It’s a common scenario that holds back even the most innovative operations.
This lack of a clear, visual summary means opportunities for improvement are missed. Managers might not see trends in production efficiency or understand the true cost of downtime until it's too late. It becomes an uphill battle to keep production lines humming and costs optimized.
The competitive landscape demands agility and precision. Businesses that can quickly adapt to market changes or optimize their internal processes are the ones that thrive. Without robust data visualization, this level of responsiveness is simply out of reach, leaving many playing catch-up.
Simply put, if you cannot measure it effectively, you cannot improve it. This often leads to frustration among teams and a ceiling on growth potential. Many businesses are now realizing the critical need for better data tools.
How Excel Manufacturing Dashboard Templates Drive Efficiency
Excel manufacturing dashboard templates are fantastic because they offer a familiar platform for complex tasks. Most people already know their way around Excel, making the learning curve much smoother than with entirely new software. These templates give you a head start, combining pre-built layouts with customizable features, so you can track what truly matters for your operations.
They act as a bridge between raw data and understandable insights. Instead of sifting through endless rows of numbers, you get charts, graphs, and clear indicators that show performance at a glance. This visual approach helps everyone from floor supervisors to top executives grasp the operational pulse quickly, fostering a more informed team environment.
Setting up your own dashboard means you're taking control of your data narrative. You decide which KPIs are most important—be it production volume, defect rates, or machine uptime—and how they are displayed. This customization ensures your dashboard serves your specific business needs, not just generic industry benchmarks, making it a powerful analytical tool.
Best of all, these dashboards enable proactive management. By continuously monitoring key metrics, you can spot potential problems before they escalate into major issues. For example, a dip in machine efficiency might signal a need for maintenance, preventing costly breakdowns and production halts down the line.
| Dashboard Benefit | Impact on Manufacturing | Why It Matters Now |
|---|---|---|
| Real-time Monitoring | Quick issue detection, less downtime | Agile response to market changes |
| Performance Visibility | Clear understanding of KPIs | Informed decision-making for growth |
| Cost Reduction | Identifies waste and inefficiencies | Boosts profitability in tight markets |
| Strategic Planning | Data-driven forecasts and goals | Future-proofs operations and investments |
Getting Started with Your First Manufacturing Dashboard
To really dive in, you'll want to start by identifying your most critical manufacturing Key Performance Indicators or KPIs. These are the numbers that truly tell you if your factory is running well. Think about things like overall equipment effectiveness, on-time delivery rates, or how much scrap material you're generating, as these directly impact your bottom line.
Once you have your KPIs, collecting the right data is the next big step. This might involve pulling information from different departments—production logs, inventory systems, or quality control reports. Consistency is key here; make sure your data is accurate and updated regularly, otherwise your dashboard will show you misleading results.
Now comes the fun part: picking or building your Excel template. Many excellent free and paid Excel manufacturing dashboard templates are available online. Look for one that resonates with your selected KPIs and allows for easy input and visualization, making sure it can handle the complexity of your specific manufacturing processes without becoming overwhelming.
Advanced Tips for Your Manufacturing Dashboards
Once you have a basic Excel manufacturing dashboard template up and running, you can take it to the next level by integrating conditional formatting. This cool feature lets you set rules to automatically change cell colors based on values. For instance, production numbers below target could turn red, while those above turn green, giving you instant visual alerts and highlighting areas needing immediate attention.
Another powerful move is to set up automated data refreshing. Manually updating a dashboard is fine initially, but as your data grows, it becomes a chore. Explore Excel's 'Get & Transform Data' features to connect directly to your production databases or other data sources. This way, your dashboard stays current with minimal effort, providing genuinely real-time insights.
Consider adding interactive elements like slicers and timelines. Slicers allow you to filter data dynamically, letting you quickly view performance by shift, product line, or operator with just a click. Timelines are perfect for analyzing trends over different periods, making it easy to zoom in on specific weeks or months and understand historical performance at a glance.
| Advanced Dashboard Feature | Why It Elevates Your Dashboard | Key Benefit for Operations |
|---|---|---|
| Conditional Formatting | Instant visual alerts for performance | Proactive issue identification |
| Automated Data Refresh | Ensures real-time, accurate insights | Reduces manual effort and errors |
| Interactive Slicers | Dynamic data filtering and analysis | Flexible, deep-dive reporting |
| Trend Analysis Charts | Identifies patterns and forecasts | Strategic planning and foresight |
Common Pitfalls and Future Trends in Dashboard Use
One common pitfall when using excel manufacturing dashboard templates is overcomplication. It’s tempting to include every single data point, but a cluttered dashboard defeats its purpose. Focus on clarity and the most impactful KPIs; a simple, effective dashboard is far more useful than a complex, confusing one. Resist the urge to add features that don't directly serve your analytical goals.
Another trap is relying solely on outdated data. A dashboard is only as good as the information it displays. Make sure your data sources are reliable and updated frequently. If you're looking at last month's numbers to make today's decisions, you're already behind the curve and missing critical shifts in your operations.
Looking ahead, the future of manufacturing dashboards is exciting, even within Excel. Expect to see more integration with AI-powered insights that can predict potential machine failures or demand shifts. Enhanced mobile accessibility will also become standard, allowing managers to monitor their plants from anywhere, ensuring real-time oversight and responsiveness.
FAQ Section
What is an Excel manufacturing dashboard template
An Excel manufacturing dashboard template is a pre-designed spreadsheet that helps visualize key operational data for factories and production facilities. It typically includes charts, graphs, and tables to display metrics like production volume, inventory levels, machine uptime, and quality control results, enabling quick analysis and informed decision-making for manufacturing managers and team leads.
Why are manufacturing dashboards important for production management
Manufacturing dashboards are crucial for production management because they offer a centralized, real-time view of performance indicators. This visibility allows managers to quickly identify bottlenecks, track progress against goals, optimize resource allocation, and react swiftly to unexpected issues. They transform raw data into actionable insights, driving efficiency and ultimately improving profitability for the entire operation.
How can I create a basic manufacturing dashboard in Excel
To create a basic Excel manufacturing dashboard, start by gathering your key data in a structured table, such as daily production numbers or defect rates. Next, use Excel's charting tools to visualize this data, creating simple bar charts for volume or line graphs for trends. Organize these charts logically on a single sheet, adding clear labels and titles to ensure readability and easy comprehension for your team.
What KPIs should an Excel manufacturing dashboard include
A robust Excel manufacturing dashboard should include KPIs like Overall Equipment Effectiveness OEE, production output, defect rate, on-time delivery percentage, and inventory turnover. Also consider machine downtime, labor costs per unit, and energy consumption. The specific KPIs will depend on your industry and goals, but these core metrics provide a comprehensive view of operational health and efficiency.
Are there free Excel templates for manufacturing dashboards
Yes, many websites offer free Excel manufacturing dashboard templates that you can download and customize. These resources are excellent starting points for small to medium-sized businesses or individuals looking to experiment with data visualization without investing in expensive software. They often provide pre-built structures for common manufacturing metrics, saving you significant time and effort in setup.
Conclusion
Embracing Excel manufacturing dashboard templates isn't just about pretty charts; it's about gaining clarity, control, and a competitive edge in a dynamic industry. For young professionals, mastering these tools translates directly into tangible skills that drive efficiency and empower smarter decisions. The ability to transform raw operational data into clear, actionable insights is an invaluable asset.
Now is the perfect moment to dive in. With the rapid pace of change in manufacturing, businesses that can quickly adapt and optimize their processes are the ones that thrive. These dashboards provide the real-time visibility needed to make those critical adjustments, ensuring your production stays on track and your business remains agile.
So, take the leap! Download a template, gather your data, and start building your first Excel manufacturing dashboard. You'll quickly see how this powerful tool can help streamline your operations, reduce waste, and ultimately propel your business forward. The insights you gain will not only solve existing problems but also illuminate new pathways for growth.